Troubleshooting
Run a Canary from the CLI
The easiest method of troubleshooting is to run the canary-checker run command with a copy of the canary resource locally. This increases velocity of troubleshooting iteration, and also prevents the possibility of sensitive information in verbose output being leaked to logging systems by the canary pod.
- Linux (amd64)
- Linux (arm64)
- MacOSX (amd64)
- MacOSX (arm64)
- Makefile
- Windows
wget  https://github.com/flanksource/canary-checker/releases/latest/download/canary-checker_linux_amd64   \
  -O /usr/bin/canary-checker && \
  chmod +x /usr/bin/canary-checker
wget  https://github.com/flanksource/canary-checker/releases/latest/download/canary-checker_linux_arm64  \
  -O /usr/bin/canary-checker && \
  chmod +x /usr/bin/canary-checker
wget https://github.com/flanksource/canary-checker/releases/latest/download/canary-checker_darwin_amd64  \
  -O /usr/local/bin/canary-checker && \
  chmod +x /usr/local/bin/canary-checker
wget https://github.com/flanksource/canary-checker/releases/latest/download/canary-checker_darwin_arm64  \
  -O /usr/local/bin/canary-checker && \
  chmod +x /usr/local/bin/canary-checker
OS = $(shell uname -s | tr '[:upper:]' '[:lower:]')
ARCH = $(shell uname -m | sed 's/x86_64/amd64/')
wget -nv -nc https://github.com/flanksource/canary-checker/releases/latest/download/canary-checker_$(OS)_$(ARCH)  \\
  -O /usr/local/bin/canary-checker && \\
  chmod +x /usr/local/bin/canary-checker
wget -nv -nc -O https://github.com/flanksource/canary-checker/releases/latest/download/canary-checker.exe
Configuring the environment
The local canary-checker execution may need to be provided with the permissions required to run the check. Depending on the check this might include:
- The ability to read secrets or other objects in the cluster
- Access to cloud APIs, such as AWS, GCP or Azure API interfaces
- Locally installed binaries invoked by
execscripts
The following local settings will affect the permissions available for use by the canary-checker executable:
- The active kubectl context as specified in
KUBECONFIG - The AWS profile specified in
AWS_DEFAULT_PROFILEorAWS_PROFILE, or the AWS credentials specified byAWS_ACCESS_KEY_IDandAWS_SECRET_ACCESS_KEY - The GCP credentials configured through
gcloud auth application-default login - The
$PATHconfiguration
kubectl get canary test-canary -n test-namespace -o yaml \
    | yq '.metadata.annotations.trace = "true"' > test-canary.yaml
canary-checker run -v test-canary.yaml
Trigger a run fom the CLI
To run a canary outside of its normal schedule add the next-runtime annotation:
kubectl annotate canary <canary> next-runtime=$(date -Iseconds)
Pausing a canary
To pause a canary from running add a suspend: true annotation or set the schedule to 0 or @never
kubectl annotate canary <canary> supend=true
Logging
To add detailed debug information related to a specific Canary to the log output, add a debug: true or trace: true annotation to the Canary resource:
trace.yamlapiVersion: canaries.flanksource.com/v1
kind: Canary
metadata:
  name: http-check
  annotations:
    trace: "true"
spec:
  http:
    - url: https://httpbin.demo.aws.flanksource.com/headers
which results in an output similar to the below:
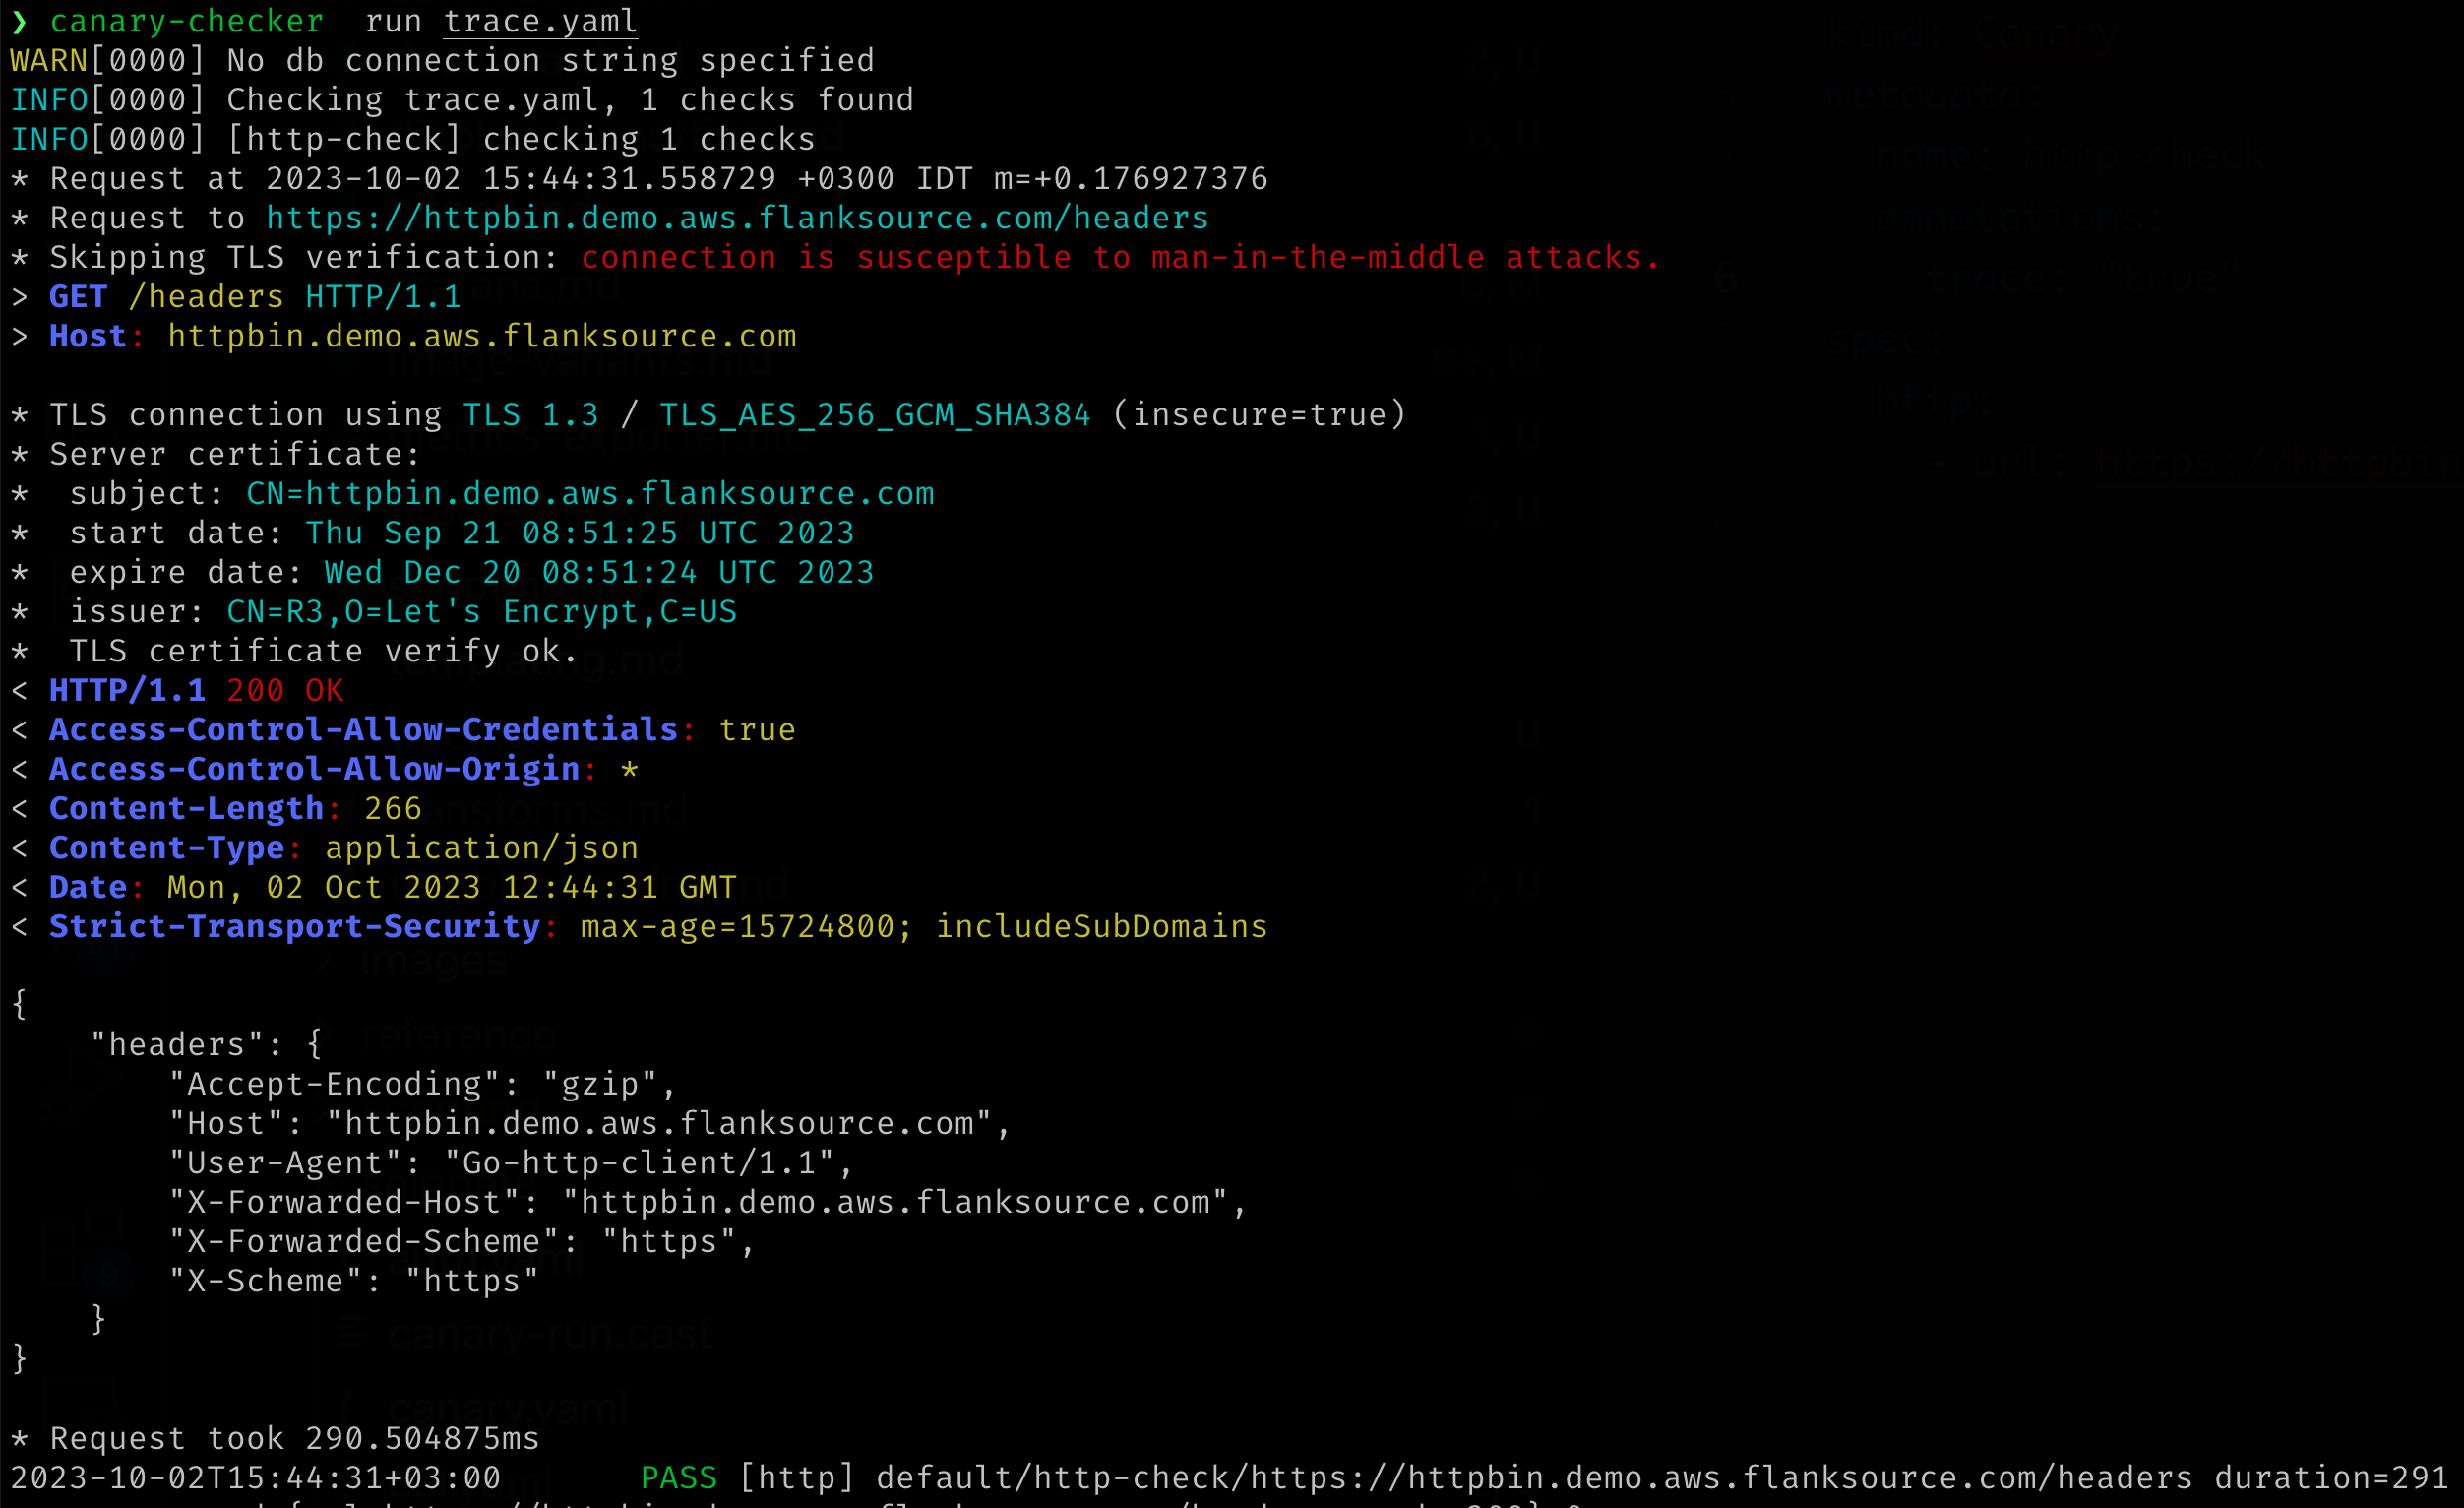
Trace level logging will return the HTTP response body which may contain sensitive data (The authorization headers will be sanitized)
Trace Levels
| Level | Logs |
|---|---|
debug | - HTTP Request and Response Header |
trace | - HTTP Request and Response Header - HTTP Response Body - Custom Metrics |
Global Logging Levels
Logging levels can be set on the command line using -v --db-log-level e.g. -vvv which is equivalent to -v=3 or using the `canary-checker.logLevel: -vvv" helm value.
| Level | Description |
|---|---|
info (0) | Startup and informational messages |
debug (1) | |
trace (2) | |
trace (3) | Prints all canary failures |
trace (4) | Prints all canary passes |
trace (5) | Enables canary level debug for all canaries |
trace (6) | Enables canary level trace for all canaries |
trace (7) | Kubernetes API calls |
trace (8) | Kubernetes API calls with responses |
trace (9) | Kubernetes API calls with requests and responses |
Database level logging can be enabled using --db-log-level
| Level | Description |
|---|---|
debug (1) | Print SQL statements without parameters |
trace (2) | Print SQL statements with parameters |
And Kubernetes Operator loggined with --k8s-log-level
| Level | Description |
|---|---|
warn (-1) | Print SQL statements without parameters |
info (0) | Prints events |
debug (1) | |
trace (2) |